파일:Crude oil spread.svg

원본 파일 (SVG 파일, 실제 크기 825 × 300 픽셀, 파일 크기: 57 KB)
이 이미지는 항상 최신의 것이 요구됩니다. 필요에 따라서 자유롭게 갱신해주세요. 비고: See code snippet in file description and section “Raw” data for details.
|
파일 설명
| 설명 |
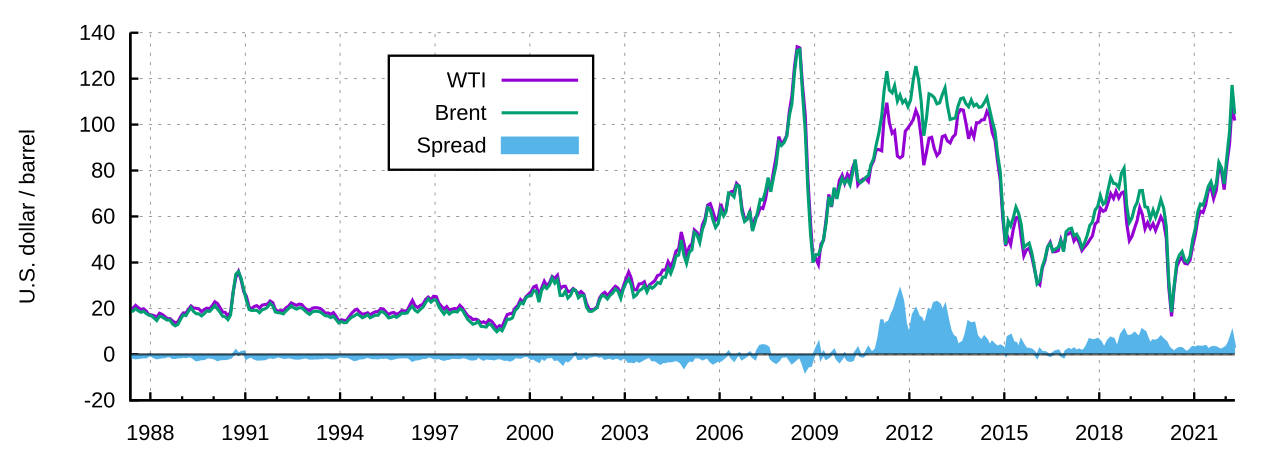
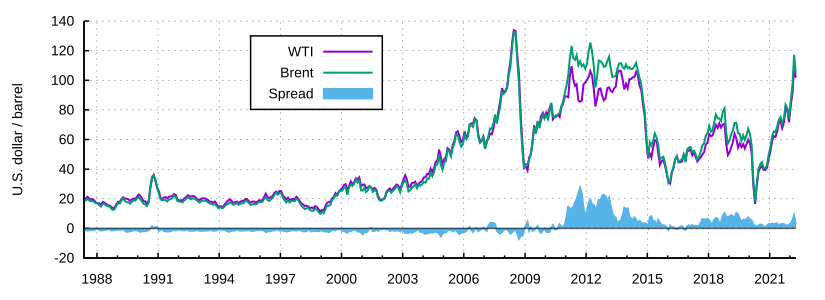
Deutsch: Preisentwicklung der Ölsorten West Texas Intermediate (WTI) und Brent sowie die Entwicklung des Preisunterschiedes („Spread“ = Brent minus WTI) zwischen beiden Sorten, Rohdaten: siehe unten.
English: Price and spread (= Brent minus WTI) histories of the two crude oil types West Texas Intermediate (WTI) and Brent, raw data: see below |
| 날짜 | |
| 출처 | 자작 |
| 저자 | StefanPohl, updated by Gretarsson |
| SVG 발전 | |
| 소스 코드 | Gnuplot code# Gnuplot version this code was run upon: 5.2
set xdata time
set xrange ["15/05/87":"15/04/22"]
set format x "%Y"
set yrange [-20:140]
set ylabel "U.S. dollar / barrel"
set border 3 lw 1.5
set tics nomirror scale 0.5
set key at "01/01/02",130 box lw 1.5 width 0.5 height 0.5
set grid
set terminal svg size 825,300 font "Arial, 14"
set output "Crude oil spread.svg"
plot "WTI_brent_spread.txt" u 1:2 w l lw 2 t "WTI", "WTI_brent_spread.txt" u 1:3 w l lw 2 t "Brent", "WTI_brent_spread.txt" u 1:4:(0) w filledcurve t "Spread", "WTI_brent_spread.txt" u 1:4 w l lc rgb "#56B4E9" lw 2 notitle, 0 lc rgb "#66000000" lw 1.5 notitle
|
라이선스
| 이 파일은 크리에이티브 커먼즈 CC0 1.0 보편적 퍼블릭 도메인 귀속에 따라 이용할 수 있습니다. | |
| 저작물에 본 권리증서를 첨부한 자는 법률에서 허용하는 범위 내에서 저작인접권 및 관련된 모든 권리들을 포함하여 저작권법에 따라 전 세계적으로 해당 저작물에 대해 자신이 갖는 일체의 권리를 포기함으로써 저작물을 퍼블릭 도메인으로 양도하였습니다. 저작권자의 허락을 구하지 않아도 이 저작물을 상업적인 목적을 포함하여 모든 목적으로 복제, 수정·변경, 배포, 공연·실연할 수 있습니다.
|
“Raw” data
#Date	WTI	Brent	Spread
15/05/87	19.44	18.58	-0.86
15/06/87	20.07	18.86	-1.21
15/07/87	21.34	19.86	-1.48
15/08/87	20.31	18.98	-1.33
15/09/87	19.53	18.31	-1.22
15/10/87	19.86	18.76	-1.1
15/11/87	18.85	17.78	-1.07
15/12/87	17.28	17.05	-0.23
15/01/88	17.13	16.75	-0.38
15/02/88	16.8	15.73	-1.07
15/03/88	16.2	14.73	-1.47
15/04/88	17.86	16.6	-1.26
15/05/88	17.42	16.31	-1.11
15/06/88	16.53	15.54	-0.99
15/07/88	15.5	14.91	-0.59
15/08/88	15.52	14.89	-0.63
15/09/88	14.54	13.18	-1.36
15/10/88	13.77	12.41	-1.36
15/11/88	14.14	13.02	-1.12
15/12/88	16.38	15.31	-1.07
15/01/89	18.02	17.17	-0.85
15/02/89	17.94	16.89	-1.05
15/03/89	19.48	18.7	-0.78
15/04/89	21.07	20.32	-0.75
15/05/89	20.12	18.63	-1.49
15/06/89	20.05	17.67	-2.38
15/07/89	19.78	17.62	-2.16
15/08/89	18.58	16.77	-1.81
15/09/89	19.59	17.77	-1.82
15/10/89	20.1	18.91	-1.19
15/11/89	19.86	18.73	-1.13
15/12/89	21.1	19.84	-1.26
15/01/90	22.86	21.25	-1.61
15/02/90	22.11	19.81	-2.3
15/03/90	20.39	18.39	-2
15/04/90	18.43	16.61	-1.82
15/05/90	18.2	16.35	-1.85
15/06/90	16.7	15.1	-1.6
15/07/90	18.45	17.17	-1.28
15/08/90	27.31	27.17	-0.14
15/09/90	33.51	34.9	1.39
15/10/90	36.04	36.02	-0.02
15/11/90	32.33	33.07	0.74
15/12/90	27.28	28.27	0.99
15/01/91	25.23	23.57	-1.66
15/02/91	20.48	19.54	-0.94
15/03/91	19.9	19.08	-0.82
15/04/91	20.83	19.18	-1.65
15/05/91	21.23	19.19	-2.04
15/06/91	20.19	18.17	-2.02
15/07/91	21.4	19.4	-2
15/08/91	21.69	19.77	-1.92
15/09/91	21.89	20.5	-1.39
15/10/91	23.23	22.21	-1.02
15/11/91	22.46	21.11	-1.35
15/12/91	19.5	18.41	-1.09
15/01/92	18.79	18.16	-0.63
15/02/92	19.01	18.05	-0.96
15/03/92	18.92	17.63	-1.29
15/04/92	20.23	18.92	-1.31
15/05/92	20.98	19.89	-1.09
15/06/92	22.39	21.16	-1.23
15/07/92	21.78	20.24	-1.54
15/08/92	21.34	19.74	-1.6
15/09/92	21.88	20.27	-1.61
15/10/92	21.69	20.26	-1.43
15/11/92	20.34	19.21	-1.13
15/12/92	19.41	18.14	-1.27
15/01/93	19.03	17.39	-1.64
15/02/93	20.09	18.47	-1.62
15/03/93	20.32	18.79	-1.53
15/04/93	20.25	18.67	-1.58
15/05/93	19.95	18.51	-1.44
15/06/93	19.09	17.65	-1.44
15/07/93	17.89	16.78	-1.11
15/08/93	18.01	16.7	-1.31
15/09/93	17.5	16.01	-1.49
15/10/93	18.15	16.61	-1.54
15/11/93	16.61	15.2	-1.41
15/12/93	14.52	13.73	-0.79
15/01/94	15.03	14.29	-0.74
15/02/94	14.78	13.8	-0.98
15/03/94	14.68	13.82	-0.86
15/04/94	16.42	15.23	-1.19
15/05/94	17.89	16.19	-1.7
15/06/94	19.06	16.76	-2.3
15/07/94	19.66	17.6	-2.06
15/08/94	18.38	16.89	-1.49
15/09/94	17.45	15.9	-1.55
15/10/94	17.72	16.49	-1.23
15/11/94	18.07	17.19	-0.88
15/12/94	17.16	15.93	-1.23
15/01/95	18.04	16.55	-1.49
15/02/95	18.57	17.11	-1.46
15/03/95	18.54	17.01	-1.53
15/04/95	19.9	18.65	-1.25
15/05/95	19.74	18.35	-1.39
15/06/95	18.45	17.31	-1.14
15/07/95	17.33	15.85	-1.48
15/08/95	18.02	16.1	-1.92
15/09/95	18.23	16.7	-1.53
15/10/95	17.43	16.11	-1.32
15/11/95	17.99	16.86	-1.13
15/12/95	19.03	17.93	-1.1
15/01/96	18.86	17.85	-1.01
15/02/96	19.09	18	-1.09
15/03/96	21.33	19.85	-1.48
15/04/96	23.5	20.9	-2.6
15/05/96	21.17	19.15	-2.02
15/06/96	20.42	18.46	-1.96
15/07/96	21.3	19.57	-1.73
15/08/96	21.9	20.51	-1.39
15/09/96	23.97	22.63	-1.34
15/10/96	24.88	24.16	-0.72
15/11/96	23.71	22.76	-0.95
15/12/96	25.23	23.78	-1.45
15/01/97	25.13	23.54	-1.59
15/02/97	22.18	20.85	-1.33
15/03/97	20.97	19.13	-1.84
15/04/97	19.7	17.56	-2.14
15/05/97	20.82	19.02	-1.8
15/06/97	19.26	17.58	-1.68
15/07/97	19.66	18.46	-1.2
15/08/97	19.95	18.6	-1.35
15/09/97	19.8	18.46	-1.34
15/10/97	21.33	19.87	-1.46
15/11/97	20.19	19.17	-1.02
15/12/97	18.33	17.18	-1.15
15/01/98	16.72	15.19	-1.53
15/02/98	16.06	14.07	-1.99
15/03/98	15.12	13.1	-2.02
15/04/98	15.35	13.53	-1.82
15/05/98	14.91	14.36	-0.55
15/06/98	13.72	12.21	-1.51
15/07/98	14.17	12.08	-2.09
15/08/98	13.47	11.91	-1.56
15/09/98	15.03	13.34	-1.69
15/10/98	14.46	12.7	-1.76
15/11/98	13	11.04	-1.96
15/12/98	11.35	9.82	-1.53
15/01/99	12.52	11.11	-1.41
15/02/99	12.01	10.27	-1.74
15/03/99	14.68	12.51	-2.17
15/04/99	17.31	15.29	-2.02
15/05/99	17.72	15.23	-2.49
15/06/99	17.92	15.86	-2.06
15/07/99	20.1	19.08	-1.02
15/08/99	21.28	20.22	-1.06
15/09/99	23.8	22.54	-1.26
15/10/99	22.69	22	-0.69
15/11/99	25	24.58	-0.42
15/12/99	26.1	25.47	-0.63
15/01/00	27.26	25.51	-1.75
15/02/00	29.37	27.78	-1.59
15/03/00	29.84	27.49	-2.35
15/04/00	25.72	22.76	-2.96
15/05/00	28.79	27.74	-1.05
15/06/00	31.82	29.8	-2.02
15/07/00	29.7	28.68	-1.02
15/08/00	31.26	30.2	-1.06
15/09/00	33.88	33.14	-0.74
15/10/00	33.11	30.96	-2.15
15/11/00	34.42	32.55	-1.87
15/12/00	28.44	25.66	-2.78
15/01/01	29.59	25.62	-3.97
15/02/01	29.61	27.5	-2.11
15/03/01	27.25	24.5	-2.75
15/04/01	27.49	25.66	-1.83
15/05/01	28.63	28.31	-0.32
15/06/01	27.6	27.85	0.25
15/07/01	26.43	24.61	-1.82
15/08/01	27.37	25.68	-1.69
15/09/01	26.2	25.62	-0.58
15/10/01	22.17	20.54	-1.63
15/11/01	19.64	18.8	-0.84
15/12/01	19.39	18.71	-0.68
15/01/02	19.72	19.42	-0.3
15/02/02	20.72	20.28	-0.44
15/03/02	24.53	23.7	-0.83
15/04/02	26.18	25.73	-0.45
15/05/02	27.04	25.35	-1.69
15/06/02	25.52	24.08	-1.44
15/07/02	26.97	25.74	-1.23
15/08/02	28.39	26.65	-1.74
15/09/02	29.66	28.4	-1.26
15/10/02	28.84	27.54	-1.3
15/11/02	26.35	24.34	-2.01
15/12/02	29.46	28.33	-1.13
15/01/03	32.95	31.18	-1.77
15/02/03	35.83	32.77	-3.06
15/03/03	33.51	30.61	-2.9
15/04/03	28.17	25	-3.17
15/05/03	28.11	25.86	-2.25
15/06/03	30.66	27.65	-3.01
15/07/03	30.76	28.35	-2.41
15/08/03	31.57	29.89	-1.68
15/09/03	28.31	27.11	-1.2
15/10/03	30.34	29.61	-0.73
15/11/03	31.11	28.75	-2.36
15/12/03	32.13	29.81	-2.32
15/01/04	34.31	31.28	-3.03
15/02/04	34.69	30.86	-3.83
15/03/04	36.74	33.63	-3.11
15/04/04	36.75	33.59	-3.16
15/05/04	40.28	37.57	-2.71
15/06/04	38.03	35.18	-2.85
15/07/04	40.78	38.22	-2.56
15/08/04	44.9	42.74	-2.16
15/09/04	45.94	43.2	-2.74
15/10/04	53.28	49.78	-3.5
15/11/04	48.47	43.11	-5.36
15/12/04	43.15	39.6	-3.55
15/01/05	46.84	44.51	-2.33
15/02/05	48.15	45.48	-2.67
15/03/05	54.19	53.1	-1.09
15/04/05	52.98	51.88	-1.1
15/05/05	49.83	48.65	-1.18
15/06/05	56.35	54.35	-2
15/07/05	59	57.52	-1.48
15/08/05	64.99	63.98	-1.01
15/09/05	65.59	62.91	-2.68
15/10/05	62.26	58.54	-3.72
15/11/05	58.32	55.24	-3.08
15/12/05	59.41	56.86	-2.55
15/01/06	65.49	62.99	-2.5
15/02/06	61.63	60.21	-1.42
15/03/06	62.69	62.06	-0.63
15/04/06	69.44	70.26	0.82
15/05/06	70.84	69.78	-1.06
15/06/06	70.95	68.56	-2.39
15/07/06	74.41	73.67	-0.74
15/08/06	73.04	73.23	0.19
15/09/06	63.8	61.96	-1.84
15/10/06	58.89	57.81	-1.08
15/11/06	59.08	58.76	-0.32
15/12/06	61.96	62.47	0.51
15/01/07	54.51	53.68	-0.83
15/02/07	59.28	57.56	-1.72
15/03/07	60.44	62.05	1.61
15/04/07	63.98	67.49	3.51
15/05/07	63.46	67.21	3.75
15/06/07	67.49	71.05	3.56
15/07/07	74.12	76.93	2.81
15/08/07	72.36	70.76	-1.6
15/09/07	79.92	77.17	-2.75
15/10/07	85.8	82.34	-3.46
15/11/07	94.77	92.41	-2.36
15/12/07	91.69	90.93	-0.76
15/01/08	92.97	92.18	-0.79
15/02/08	95.39	94.99	-0.4
15/03/08	105.45	103.64	-1.81
15/04/08	112.58	109.07	-3.51
15/05/08	125.4	122.8	-2.6
15/06/08	133.88	132.32	-1.56
15/07/08	133.37	132.72	-0.65
15/08/08	116.67	113.24	-3.43
15/09/08	104.11	97.23	-6.88
15/10/08	76.61	71.58	-5.03
15/11/08	57.31	52.45	-4.86
15/12/08	41.12	39.95	-1.17
15/01/09	41.71	43.44	1.73
15/02/09	39.09	43.32	4.23
15/03/09	47.94	46.54	-1.4
15/04/09	49.65	50.18	0.53
15/05/09	59.03	57.3	-1.73
15/06/09	69.64	68.61	-1.03
15/07/09	64.15	64.44	0.29
15/08/09	71.05	72.51	1.46
15/09/09	69.41	67.65	-1.76
15/10/09	75.72	72.77	-2.95
15/11/09	77.99	76.66	-1.33
15/12/09	74.47	74.46	-0.01
15/01/10	78.33	76.17	-2.16
15/02/10	76.39	73.75	-2.64
15/03/10	81.2	78.83	-2.37
15/04/10	84.29	84.82	0.53
15/05/10	73.74	75.95	2.21
15/06/10	75.34	74.76	-0.58
15/07/10	76.32	75.58	-0.74
15/08/10	76.6	77.04	0.44
15/09/10	75.24	77.84	2.6
15/10/10	81.89	82.67	0.78
15/11/10	84.25	85.28	1.03
15/12/10	89.15	91.45	2.3
15/01/11	89.17	96.52	7.35
15/02/11	88.58	103.72	15.14
15/03/11	102.86	114.64	11.78
15/04/11	109.53	123.26	13.73
15/05/11	100.9	114.99	14.09
15/06/11	96.26	113.83	17.57
15/07/11	97.3	116.97	19.67
15/08/11	86.33	110.22	23.89
15/09/11	85.52	112.83	27.31
15/10/11	86.32	109.55	23.23
15/11/11	97.16	110.77	13.61
15/12/11	98.56	107.87	9.31
15/01/12	100.27	110.69	10.42
15/02/12	102.2	119.33	17.13
15/03/12	106.16	125.45	19.29
15/04/12	103.32	119.75	16.43
15/05/12	94.66	110.34	15.68
15/06/12	82.3	95.16	12.86
15/07/12	87.9	102.62	14.72
15/08/12	94.13	113.36	19.23
15/09/12	94.51	112.86	18.35
15/10/12	89.49	111.71	22.22
15/11/12	86.53	109.06	22.53
15/12/12	87.86	109.49	21.63
15/01/13	94.76	112.96	18.2
15/02/13	95.31	116.05	20.74
15/03/13	92.94	108.47	15.53
15/04/13	92.02	102.25	10.23
15/05/13	94.51	102.56	8.05
15/06/13	95.77	102.92	7.15
15/07/13	104.67	107.93	3.26
15/08/13	106.57	111.28	4.71
15/09/13	106.29	111.6	5.31
15/10/13	100.54	109.08	8.54
15/11/13	93.86	107.79	13.93
15/12/13	97.63	110.76	13.13
15/01/14	94.62	108.12	13.5
15/02/14	100.82	108.9	8.08
15/03/14	100.8	107.48	6.68
15/04/14	102.07	107.76	5.69
15/05/14	102.18	109.54	7.36
15/06/14	105.79	111.8	6.01
15/07/14	103.59	106.77	3.18
15/08/14	96.54	101.61	5.07
15/09/14	93.21	97.09	3.88
15/10/14	84.4	87.43	3.03
15/11/14	75.79	79.44	3.65
15/12/14	59.29	62.34	3.05
15/01/15	47.22	47.76	0.54
15/02/15	50.58	58.1	7.52
15/03/15	47.82	55.89	8.07
15/04/15	54.45	59.52	5.07
15/05/15	59.27	64.08	4.81
15/06/15	59.82	61.48	1.66
15/07/15	50.9	56.56	5.66
15/08/15	42.87	46.52	3.65
15/09/15	45.48	47.62	2.14
15/10/15	46.22	48.43	2.21
15/11/15	42.44	44.27	1.83
15/12/15	37.19	38.01	0.82
15/01/16	31.68	30.7	-0.98
15/02/16	30.32	32.18	1.86
15/03/16	37.55	38.21	0.66
15/04/16	40.75	41.58	0.83
15/05/16	46.71	46.74	0.03
15/06/16	48.76	48.25	-0.51
15/07/16	44.65	44.95	0.3
15/08/16	44.72	45.84	1.12
15/09/16	45.18	46.57	1.39
15/10/16	49.78	49.52	-0.26
15/11/16	45.66	44.73	-0.93
15/12/16	51.97	53.31	1.34
15/01/17	52.5	54.58	2.08
15/02/17	53.47	54.87	1.4
15/03/17	49.33	51.59	2.26
15/04/17	51.06	52.31	1.25
15/05/17	48.48	50.33	1.85
15/06/17	45.18	46.37	1.19
15/07/17	46.63	48.48	1.85
15/08/17	48.04	51.7	3.66
15/09/17	49.82	56.15	6.33
15/10/17	51.58	57.51	5.93
15/11/17	56.64	62.71	6.07
15/12/17	57.88	64.37	6.49
15/01/18	63.7	69.08	5.38
15/02/18	62.23	65.32	3.09
15/03/18	62.73	66.02	3.29
15/04/18	66.25	72.11	5.86
15/05/18	69.98	76.98	7
15/06/18	67.87	74.41	6.54
15/07/18	70.98	74.25	3.27
15/08/18	68.06	72.53	4.47
15/09/18	70.23	78.89	8.66
15/10/18	70.75	81.03	10.28
15/11/18	56.96	64.75	7.79
15/12/18	49.52	57.36	7.84
15/01/19	51.38	59.41	8.03
15/02/19	54.95	63.96	9.01
15/03/19	58.15	66.14	7.99
15/04/19	63.86	71.23	7.37
15/05/19	60.83	71.32	10.49
15/06/19	54.66	64.22	9.56
15/07/19	57.35	63.92	6.57
15/08/19	54.81	59.04	4.23
15/09/19	56.95	62.83	5.88
15/10/19	53.96	59.71	5.75
15/11/19	57.03	63.21	6.18
15/12/19	59.88	67.31	7.43
15/01/20	57.52	63.65	6.13
15/02/20	50.54	55.66	5.12
15/03/20	29.21	32.01	2.8
15/04/20	16.55	18.38	1.83
15/05/20	28.56	29.38	0.82
15/06/20	38.31	40.27	1.96
15/07/20	40.71	43.24	2.53
15/08/20	42.34	44.74	2.4
15/09/20	39.63	40.91	1.28
15/10/20	39.4	40.19	0.79
15/11/20	40.94	42.69	1.75
15/12/20	47.02	49.99	2.97
15/01/21	52	54.77	2.77
15/02/21	59.04	62.28	3.24
15/03/21	62.33	65.41	3.08
15/04/21	61.72	64.81	3.09
15/05/21	65.17	68.53	3.36
15/06/21	71.38	73.16	1.78
15/07/21	72.49	75.17	2.68
15/08/21	67.73	70.75	3.02
15/09/21	71.65	74.49	2.84
15/10/21	81.48	83.54	2.06
15/11/21	79.15	81.05	1.9
15/12/21	71.71	74.17	2.46
15/01/22	83.22	86.51	3.29
15/02/22	91.64	97.13	5.49
15/03/22	108.5	117.25	8.75
15/04/22	101.78	104.58	2.8
Der Befehlscode kann ohne weiteres in die Zwischenablage kopiert und in das Kommandozeilen-Fenster von Gnuplot eingefügt werden. Die Datei wird erstellt, indem nach dem Einfügen die ENTER-Taste betätigt wird (es sei denn, unterhalb der eingefügten Sequenz befindet sich ein Prompt -- in diesem Fall wurde der Code bereits ausgeführt und die Datei ist bereits erstellt worden!). Damit alles funktioniert, muss die .txt-Datei, die die Rohdaten enthält, WTI_brent_spread.txt genannt werden und im gleichen Verzeichnis liegen wie die gnuplot.exe (d.h. im bin-Ordner des Gnuplot-Installationsverzeichnisses). Die Crude oil spread.svg wird im gleichen Verzeichnis abgelegt werden (und wenn nicht dort, dann im Benutzer-Ordner Dokumente).
The command code can be copied to the clipboard and pasted into Gnuplot’s command line shell window. The file is created by pressing ENTER after pasting (unless there appears a prompt after the pasted sequence -- in this case the code has already been run!). In order to make it work properly the .txt file containing the raw data (see above) has to be named WTI_brent_spread.txt and has to be located in the same directory as the gnuplot.exe (i.e. the bin folder of the Gnuplot install directory). The Crude oil spread.svg will be saved in the same directory (and if not it might have been saved to the user’s folder Documents).
파일 역사
날짜/시간 링크를 클릭하면 해당 시간의 파일을 볼 수 있습니다.
| 날짜/시간 | 섬네일 | 크기 | 사용자 | 설명 | |
|---|---|---|---|---|---|
| 현재 | 2022년 5월 31일 (화) 11:22 | 825 × 300 (57 KB) | Gretarsson | Update | |
| 2018년 3월 25일 (일) 10:43 | 825 × 300 (53 KB) | Gretarsson | ‘smoothened’ area graph (“spread”) by superimposing a line graph of same color on it and decreased ticmark size by 50 %, both in order to make the diagram look more similar in style to its first version | ||
| 2018년 3월 7일 (수) 02:27 | 825 × 300 (48 KB) | Gretarsson | used decimal period in the datafile instead of comma -> more precise curves (sorry for such a beginner's mistake); some minor cosmetic changes | ||
| 2018년 3월 6일 (화) 05:37 | 825 × 300 (51 KB) | Gretarsson | update (end date Jan 2018) | ||
| 2016년 8월 7일 (일) 05:43 | 800 × 300 (45 KB) | StefanInaktiv | User created page with UploadWizard |
이 파일을 사용하는 문서
다음 문서 1개가 이 파일을 사용하고 있습니다:
이 파일을 사용하고 있는 모든 위키의 문서 목록
다음 위키에서 이 파일을 사용하고 있습니다:
- af.wiki.x.io에서 이 파일을 사용하고 있는 문서 목록
- de.wiki.x.io에서 이 파일을 사용하고 있는 문서 목록
- en.wiki.x.io에서 이 파일을 사용하고 있는 문서 목록
- es.wiki.x.io에서 이 파일을 사용하고 있는 문서 목록
- eu.wiki.x.io에서 이 파일을 사용하고 있는 문서 목록
- fa.wiki.x.io에서 이 파일을 사용하고 있는 문서 목록
- ja.wiki.x.io에서 이 파일을 사용하고 있는 문서 목록
- pt.wiki.x.io에서 이 파일을 사용하고 있는 문서 목록
- simple.wiki.x.io에서 이 파일을 사용하고 있는 문서 목록
- sv.wiki.x.io에서 이 파일을 사용하고 있는 문서 목록
- uk.wiki.x.io에서 이 파일을 사용하고 있는 문서 목록
- vi.wiki.x.io에서 이 파일을 사용하고 있는 문서 목록